After you deployed your vRA environment you can start configuring it. However I would suggest to check your deployment first to see if everything is working fine. This is also a good way to determine a baseline of your environment. In case you missed my first part about the deployment you can find it here.
Overview
To jog our memory I’m adding the layout of the vRA environment we deployed in part1.

| VRA0010 | vRealize Automation Appliance (VIP) |
| VRA0011 | vRealize Automation Appliance (Node 1) |
| VRA0012 | vRealize Automation Appliance (Node 2) |
| VRA0013 | vRealize Automation Appliance (Node 3) |
| VRAW0010 | vRealize Automation IaaS Web (VIP) |
| VRAW0011 | vRealize Automation IaaS Web + Model Manager 1 |
| VRAW0012 | vRealize Automation IaaS Web 2 |
| VRAM0010 | vRealize Automation IaaS Manager (VIP) |
| VRAM0011 | vRealize Automation IaaS Manager + DEM Orchestrator 1 |
| VRAM0012 | vRealize Automation IaaS Manager + DEM Orchestrator 2 |
| CSQL0001 | MSSQL Database Server cluster name |
| RSQL0001 | MSSQL Database Server resource (client access point) |
| SQL0001 | vRealize Automation IaaS MSSQL Database (Node 1) |
| SQL0002 | vRealize Automation IaaS MSSQL Database (Node 2) |
| VRAD001 | vRealize Automation IaaS DEM Worker (Node1) |
| VRAD002 | vRealize Automation IaaS DEM Worker (Node2) |
| VRAP001 | vRealize Automation IaaS Proxy Agent (Node 1) |
| VRAP002 | vRealize Automation IaaS Proxy Agent (Node 2) |
| VRAP003 | vRealize Automation IaaS Proxy Agent (Node 3) |
| VRAP004 | vRealize Automation IaaS Proxy Agent (Node 4) |
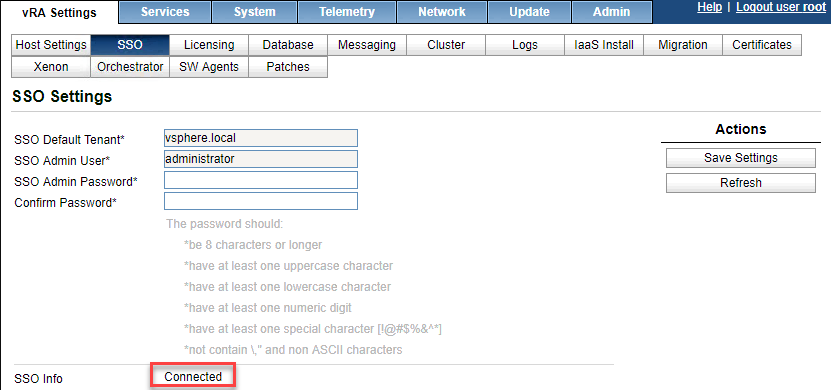
1. Check SSO
Connect to your VAMI interface https://fqdn_vra_appliance:5480. Go to vRA Settings => SSO. Check if the status of SSO is connected.
2. Check Licensing
Check if the license never expires or matches the license you received.

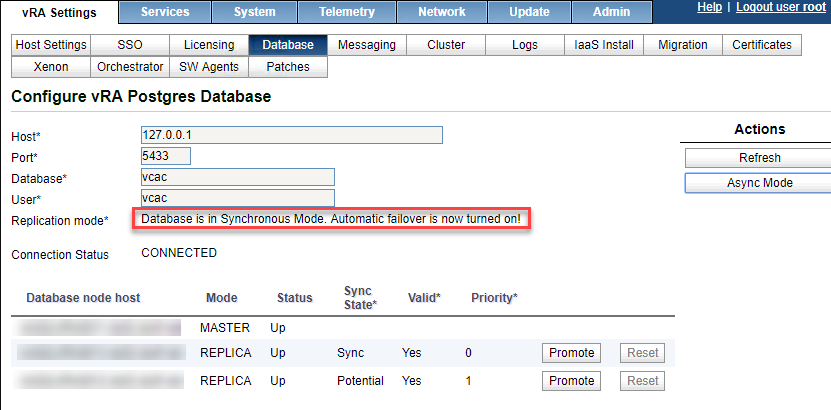
3. Check Database
By default your deployment is done in Async mode. This should be in synchronous mode. Click on “Sync Mode” and wait for the change.

When the change is done you should see below screen.
4. Check Messaging
Check if “Connection Status” is connected and “rabbitMQ process” is running.

5. Check Cluster
Check if the current node is in cluster mode

6. Check Orchestrator
Check if the embedded Orchestrator is running, if not start it.

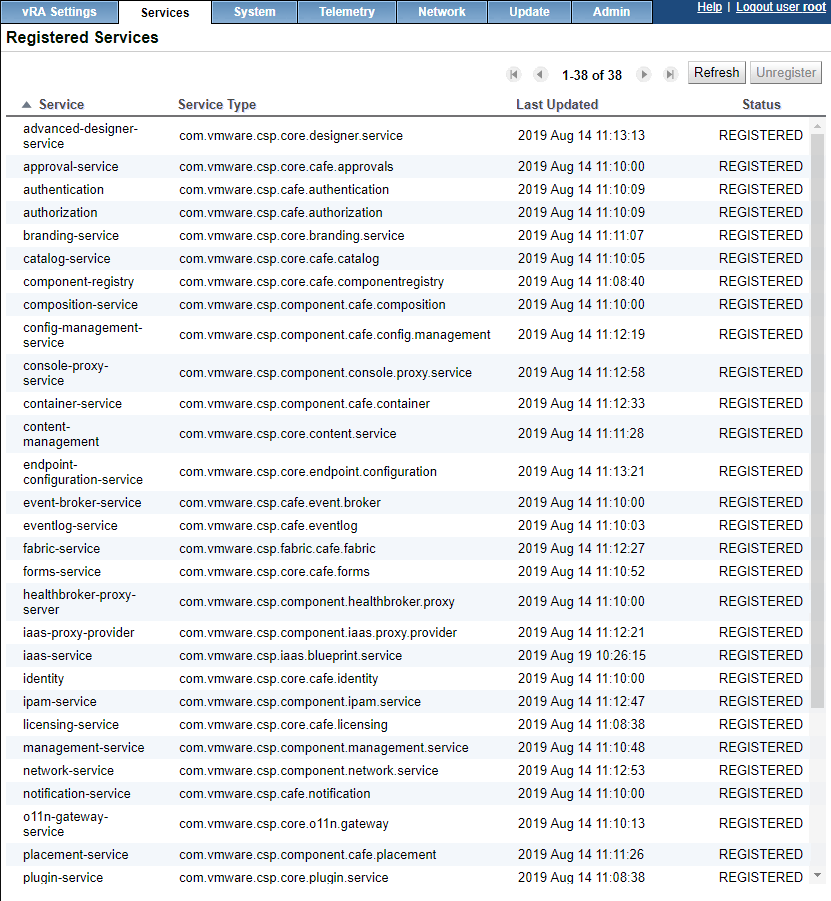
7. Check Services
Make sure that all your services are registered
8. Check Time Zone
In system => Time Zone, correct your time zone if necessary.

9. Check status Web servers
If you go to this URL (https://VRAW0011.vkasaert.com/WAPI/api/status & https://VRAW0012.vkasaert.com/WAPI/api/status) you should receive a JSON file with the config of your services. These should be in state “Registered”.
Off course you need to receive the same JSON file behind your loadbalancer URL ( https://VRAW0010.vkasaert.com/WAPI/api/status).
Do these tests with IE and add all 3 websites to your trusted sites!

10. Check status Management servers
If you go to this URL (https://VRAM0011.vkasaert.com/VMPS) you should see below image.
By default you don’t have an active-active environment on your management servers so you only need to do that on the active node you configured during your LCM deployment.
Here the same comment if you access your loadbalancer URL (https://VRAM0010.vkasaert.com/VMPS) you should get the same screen.

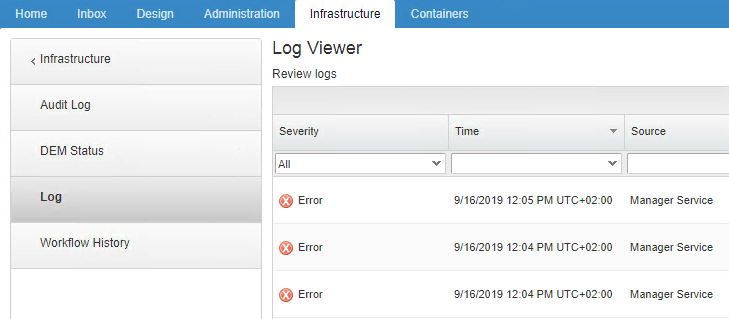
11. Check the logs of your default tenant
Connect with the “configurationadmin” userid to your default tenant https://fqdn_loadbalancer_vra_appliances/vcac/
Go to Infrastructure => Monitoring => Log and check if you have any errors. I did have some errors and you can find the solution at the end in the section encountered issues.
Closing note
If you checked all the above you should be ready to start the config of your vRA deployment. Stay tuned for my next blog article as that one will be discussing the configuration 🙂
Encountered issues
1.PhysicalHostPingService: ignoring exception: 1.
When I logged in with my configurationadmin on my default tenant I had below error in the logs (Infrastructure => Monitoring => Log)
PhysicalHostPingService: ignoring exception:
Error executing query usp_SelectAgent
Inner Exception: Error executing query usp_SelectAgentCapabilities
In the stack trace:
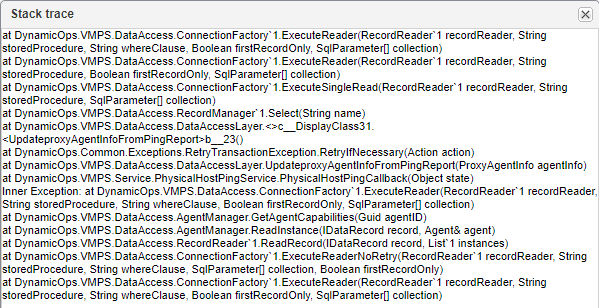
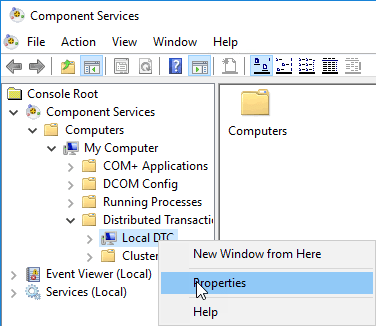
On all your Iaas & SQL servers you need to make sure that MSDTC is configured correctly. Go to Administrative tools => Component Services. Once opened go to My Computer => Distributed Transaction Coordinator => Local DTC.
Right click on “Local DTC” and choose properties.
Go to the tab security and configure as in the printscreen. In my case Network DTC Access wasn’t checked and the 4 other options neither.
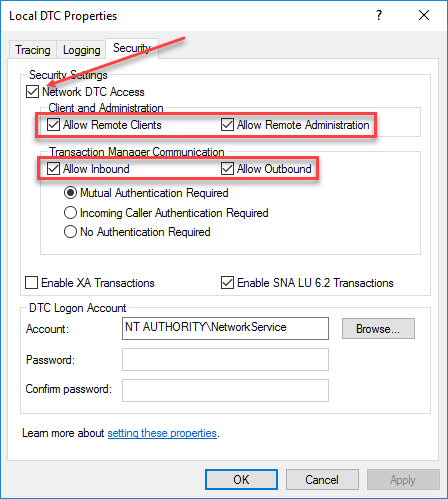
After changing this setting I had now 1 entry every 3 min. Before I had multiple entries every min. So there was progress, but not yet solved.
Because the error was related to my management servers I checked the logs @C:\Program Files (x86)\VMware\vCAC\Server\Logs\All.log. Here I could see there were still issues with MSDTC.
Content of the all.log:
System.ApplicationException: Error executing query usp_SelectAgentCapabilities —> System.Transactions.TransactionManagerCommunicationException: Communication with the underlying transaction manager has failed. —> System.Runtime.InteropServices.COMException: The MSDTC transaction manager was unable to pull the transaction from the source transaction manager due to communication problems. Possible causes are: a firewall is present and it doesn’t have an exception for the MSDTC process, the two machines cannot find each other by their NetBIOS names, or the support for network transactions is not enabled for one of the two transaction managers. (Exception from HRESULT: 0x8004D02B)
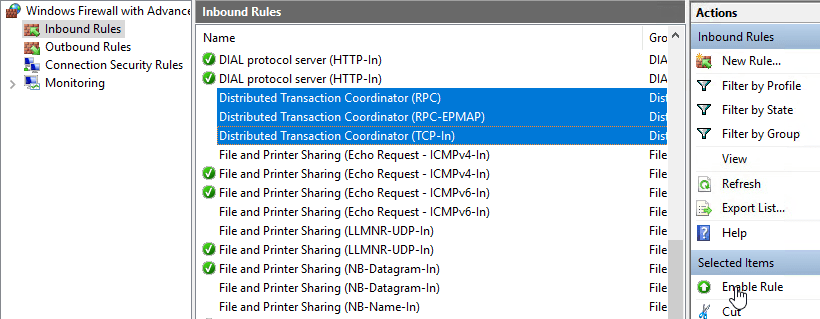
After troubleshooting, I found that I needed to enable some firewall rules because the firewall was active in this environment. In my case I had to enable below firewall rules that were linked to the Distributed Transaction Coordinator. Don’t forget that these firewall rules have to be enabled on all your Iaas & SQL servers.
Inbound Rules:
Outbound Rules:

After that all I didn’t receive anymore errors in my logs 🙂

One thought on “Deploy vRealize Automation with Lifecycle Manager (part2) – check your deployment”
Comments are closed.